Charts & Graphs
The student detail view provides visual analysis of performance development.
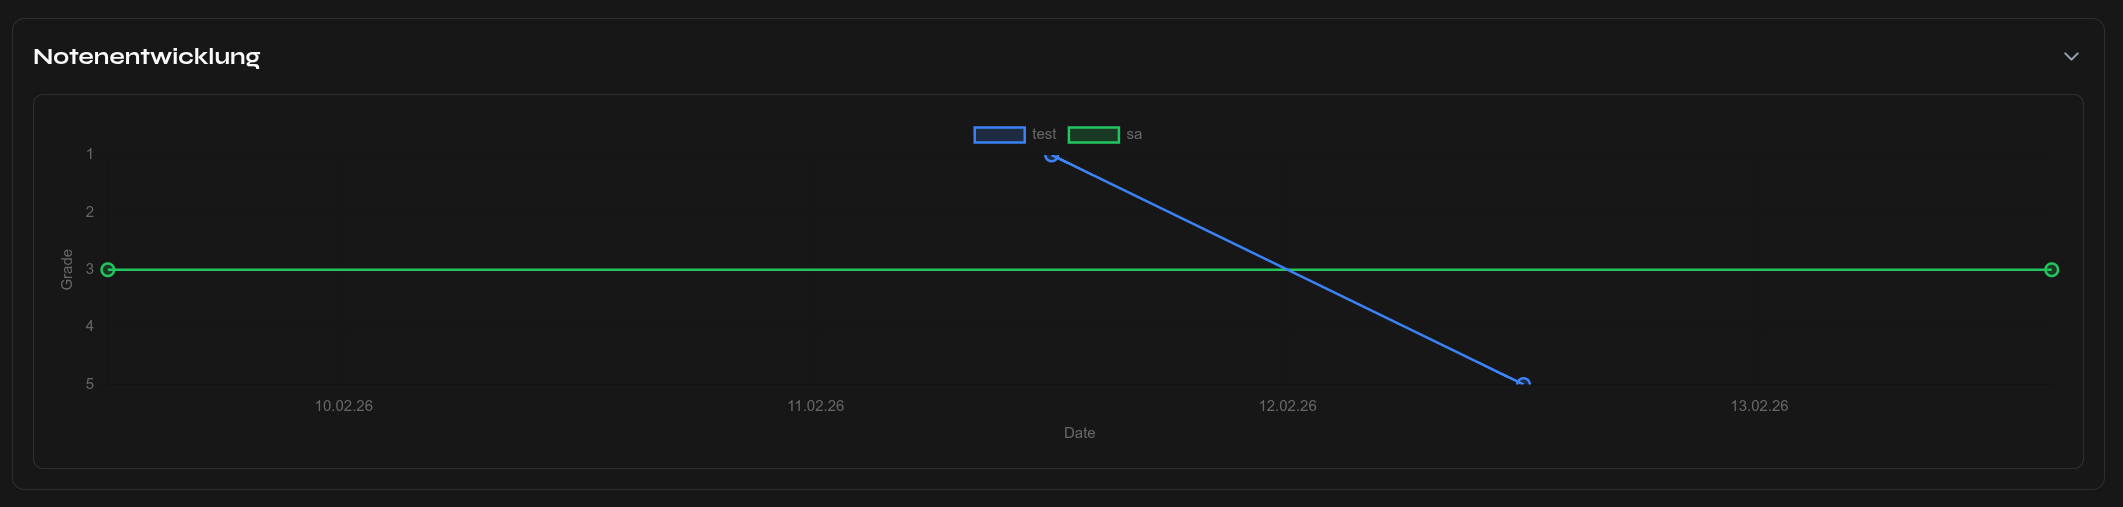
Grade Progression
The progression chart shows the student's grades over time. This helps you identify:
- Performance trends (improvement or decline)
- Outliers (unusually good or poor individual grades)
- Seasonal patterns
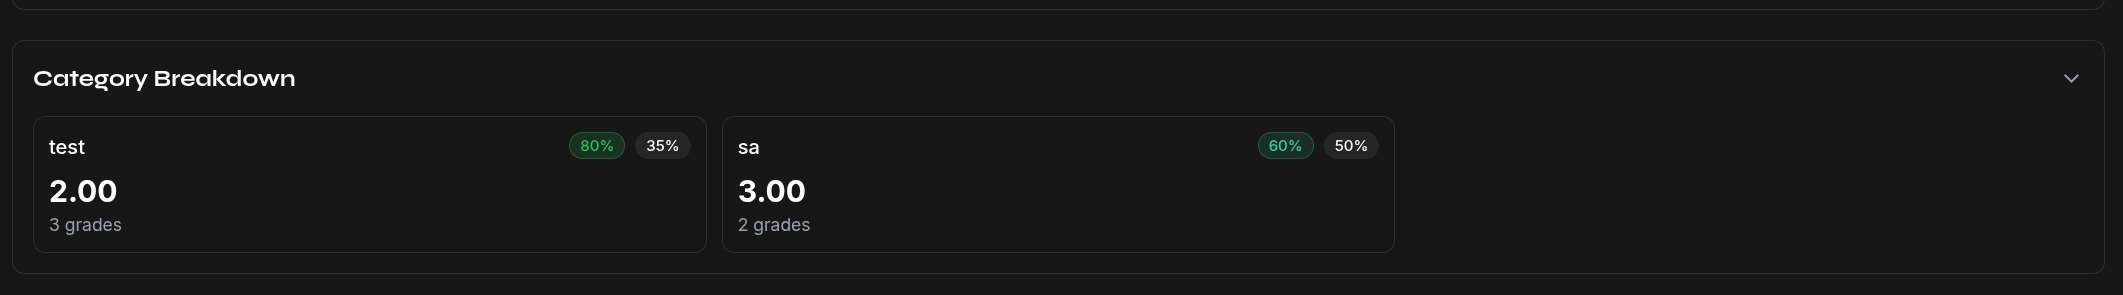
Category Breakdown
The category chart shows average performance per grade category:
- How does the student perform in exams vs. participation?
- Where are their strengths and weaknesses?
These charts are helpful for:
- Parent-teacher conferences — Visual representation of development
- Support planning — Identifying weak areas
- Performance documentation — Objective presentation over time